df <- structure(list(ID = structure(c(1L, 1L, 1L, 1L, 1L, 2L, 2L, 2L,
2L, 2L, 2L, 3L, 3L, 3L, 3L, 3L, 3L, 4L, 4L, 4L, 4L, 4L, 4L, 5L,
5L, 5L, 5L, 5L, 5L, 6L, 6L, 6L, 6L, 6L, 6L, 7L, 7L, 7L), .Label = c("1",
"2", "3", "4", "5", "6", "7"), class = "factor"), TYPE = structure(c(1L,
2L, 3L, 4L, 5L, 1L, 2L, 3L, 4L, 5L, 6L, 1L, 2L, 3L, 4L, 5L, 6L,
1L, 2L, 3L, 4L, 5L, 6L, 1L, 2L, 3L, 4L, 5L, 6L, 1L, 2L, 3L, 4L,
5L, 6L, 1L, 2L, 3L), .Label = c("1", "2", "3", "4", "5", "6",
"7", "8"), class = "factor"), TIME = structure(c(2L, 2L, 2L,
2L, 2L, 1L, 1L, 1L, 1L, 1L, 1L, 1L, 1L, 1L, 1L, 1L, 1L, 2L, 2L,
2L, 2L, 2L, 2L, 1L, 1L, 1L, 1L, 1L, 1L, 2L, 2L, 2L, 2L, 2L, 2L,
1L, 1L, 1L), .Label = c("1", "5", "15"), class = "factor"), VAL = c(0.937377670081332,
0.522220720537007, 0.278690102742985, 0.967633064137772, 0.116124767344445,
0.0544306698720902, 0.470229141646996, 0.62017166428268, 0.195459847105667,
0.732876230962574, 0.996336271753535, 0.983087373664603, 0.666449476964772,
0.291554537601769, 0.167933790013194, 0.860138458199799, 0.172361251665279,
0.833266809117049, 0.620465772924945, 0.786503327777609, 0.761877260869369,
0.425386636285111, 0.612077651312575, 0.178726130630821, 0.528709076810628,
0.492527724476531, 0.472576208412647, 0.0702785139437765, 0.696220921119675,
0.230852259788662, 0.359884874196723, 0.518227979075164, 0.259466265095398,
0.149970305617899, 0.00682218233123422, 0.463400925742462, 0.924704828299582,
0.229068386601284)), .Names = c("ID", "TYPE", "TIME", "VAL"), row.names = c(NA,
-38L), class = "data.frame")
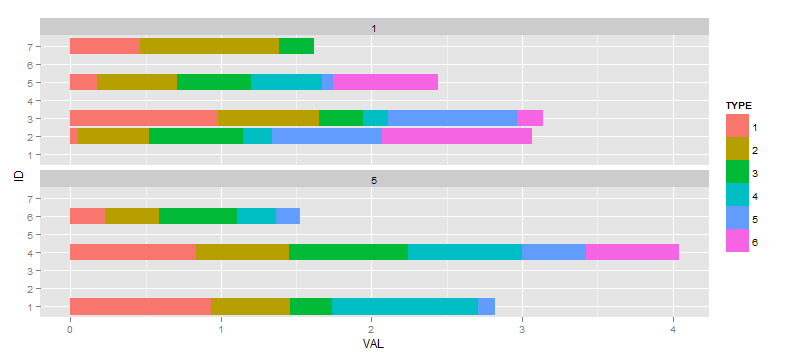
If I create the following plot:
ggplot(df, aes(x=ID, y=VAL, fill=TYPE)) +
  facet_wrap(~ TIME, ncol=1) +
  geom_bar(position="stack") +
  coord_flip()
I then decide I would ideally like to supress any factors from being shown in a facet where they don't have any data. I have referenced various questions and answers that say the scale="free" method is the way to go (as opposed to drop=TRUE which would drop empty facets corresponding to unused values in TIME), so next:
ggplot(df, aes(x=ID, y=VAL, fill=TYPE)) +
  facet_wrap(~TIME, ncol=1, scale="free") +
  geom_bar(position="stack") +
  coord_flip()
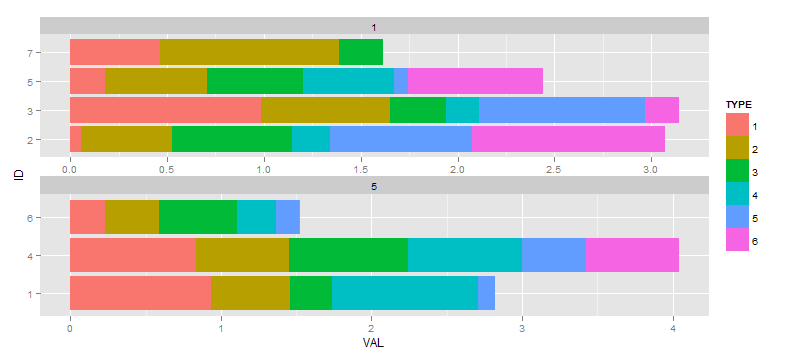
My question is how to prevent the rescaling of the bars that occurs for the facet that has 4 bars vs. the facet with 3 bars. The effect is subtle in this contrived example, much worse with my actual data. The ideal output would have the bottom facet with ID factors 1,4, and 6 on the vertical axis with bars having the same width as the top facet, and so the overall vertical dimension of the facet would be reduced.
Bonus points if you can help me with why the counts are stacked instead of the numeric values (Fixed now)
Bounty update:
As mentioned in my followup question it looks like a better solution could involve the use of ggplot_build and ggplot_table and modifying the gtable object. I'm pretty sure I could figure it out given time, but I'm hoping a bounty might motivate someone else to help me out. Koshke has posted some examples of this.
See Question&Answers more detail:
os 


